Abstract
Ophthalmologists typically require multimodal data sources to improve diagnostic accuracy in clinical decisions. However, due to medical device shortages, low-quality data and data privacy concerns, missing data modalities are common in real-world scenarios. Existing deep learning methods tend to address it by learning an implicit latent subspace representation for different modality combinations. We identify two significant limitations of these methods: (1) implicit representation constraints that hinder the model's ability to capture modality-specific information and (2) modality heterogeneity, causing distribution gaps and redundancy in feature representations. To address these, we propose an Incomplete Modality Disentangled Representation (IMDR) strategy, which disentangles features into explicit independent modal-common and modal-specific features by guidance of mutual information, distilling informative knowledge and enabling it to reconstruct valuable missing semantics and produce robust multimodal representations. Furthermore, we introduce a joint proxy learning module that assists IMDR in eliminating intra-modality redundancy by exploiting the extracted proxies from each class. Experiments on four ophthalmology multimodal datasets demonstrate that the proposed IMDR outperforms the state-of-the-art methods significantly.
Methodology

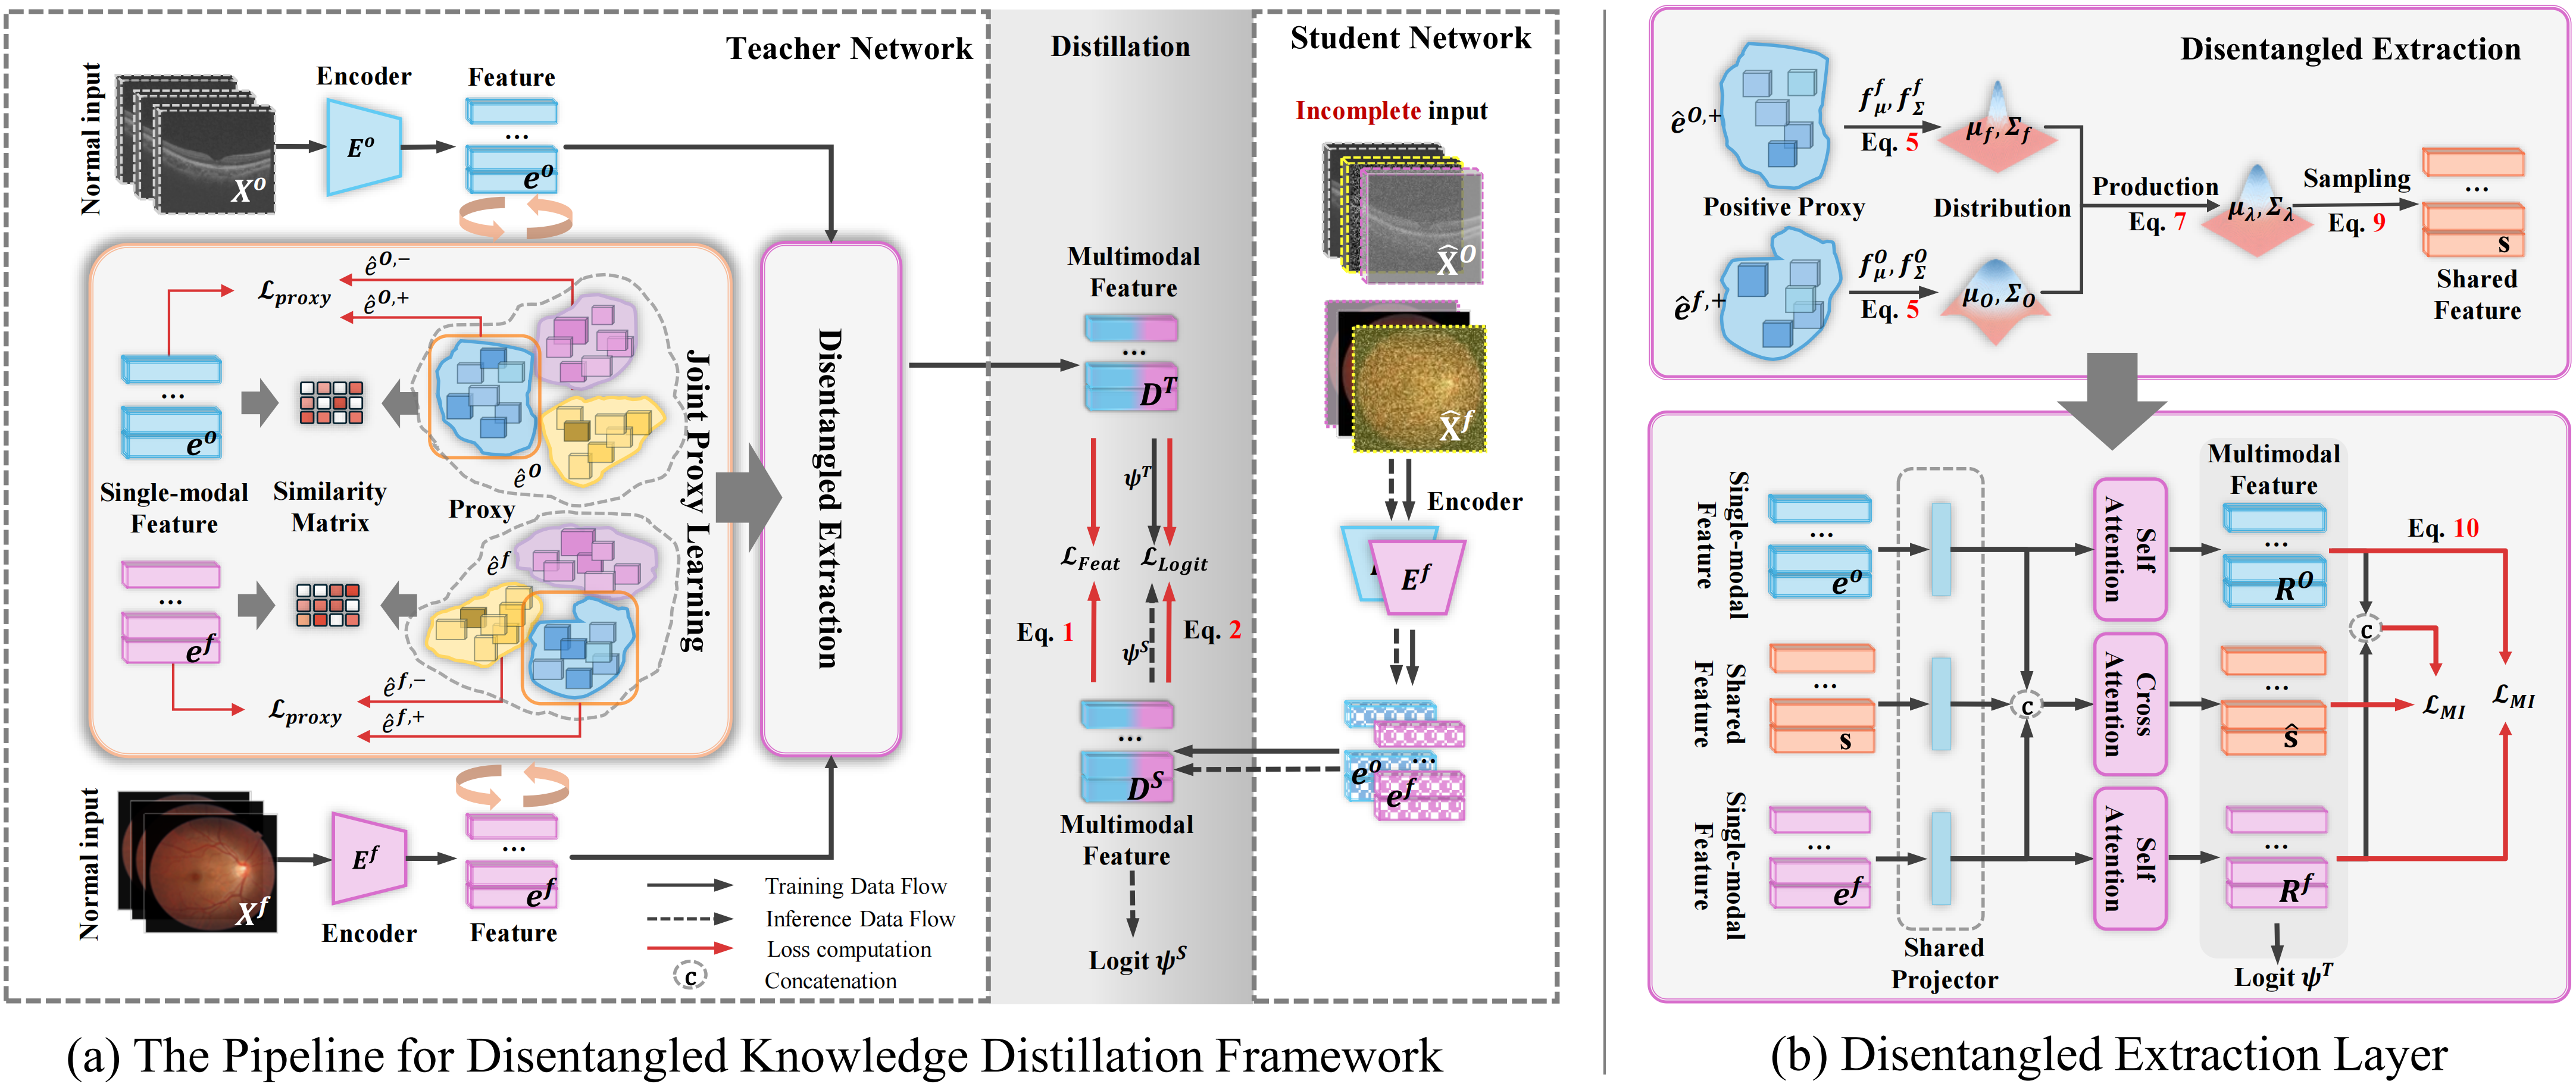
Figure 2. Overview of Our Proposed Framewor: (a) We train a teacher model using complete modality data, followed by co-training with a student model on incomplete inputs for knowledge distillation. The distillation is supervised by feature loss LFeat and logit loss LLogit. During the training of the teacher model, the encoder outputs the single-modality features ef and eO. We build a set of proxies for a modality, with each set representing a class. Positive proxies are selected by a similarity matrix between ê and e. All proxies are optimized through the proxy loss LProx. Consequently, êf,+ and êO,+, together with features ef and eO, are passed to the IMDR. (b)Details for the IMDR strategy: We estimate the distributions of êf,+ and êO,+, then combine them using Equation P(̂e | xf, xO) to obtain the joint distribution. The modality-shared feature s is sampled from this distribution. This feature s guides the decoupling via an attention layer, supervised by the loss LMI to minimize the mutual information between the extracted shared features ̂s and specific features Rf, RO, as well as between Rf and RO.
Results

Visualization

BibTeX
      @misc{liu2025incompletemodalitydisentangledrepresentation,
      title={Incomplete Modality Disentangled Representation for Ophthalmic Disease Grading and Diagnosis},
      author={Chengzhi Liu and Zile Huang and Zhe Chen and Feilong Tang and Yu Tian and Zhongxing Xu and Zihong Luo and Yalin Zheng and Yanda Meng},
      year={2025},
      eprint={2502.11724},
      archivePrefix={arXiv},
      primaryClass={cs.CV},
      url={https://arxiv.org/abs/2502.11724},
}